


DTZ
Digital Operations Visualization
Use SVG views, components, tags and events to place real-time signals back into equipment, process and responsibility context.

The problem
Traditional monitoring screens are often locked to one project and proprietary components. Appearance, signals, events and permissions become entangled and difficult to version or reuse.
The outcome
Separate visual structure from behavior and establish one model from authoring and binding through runtime and authorization.
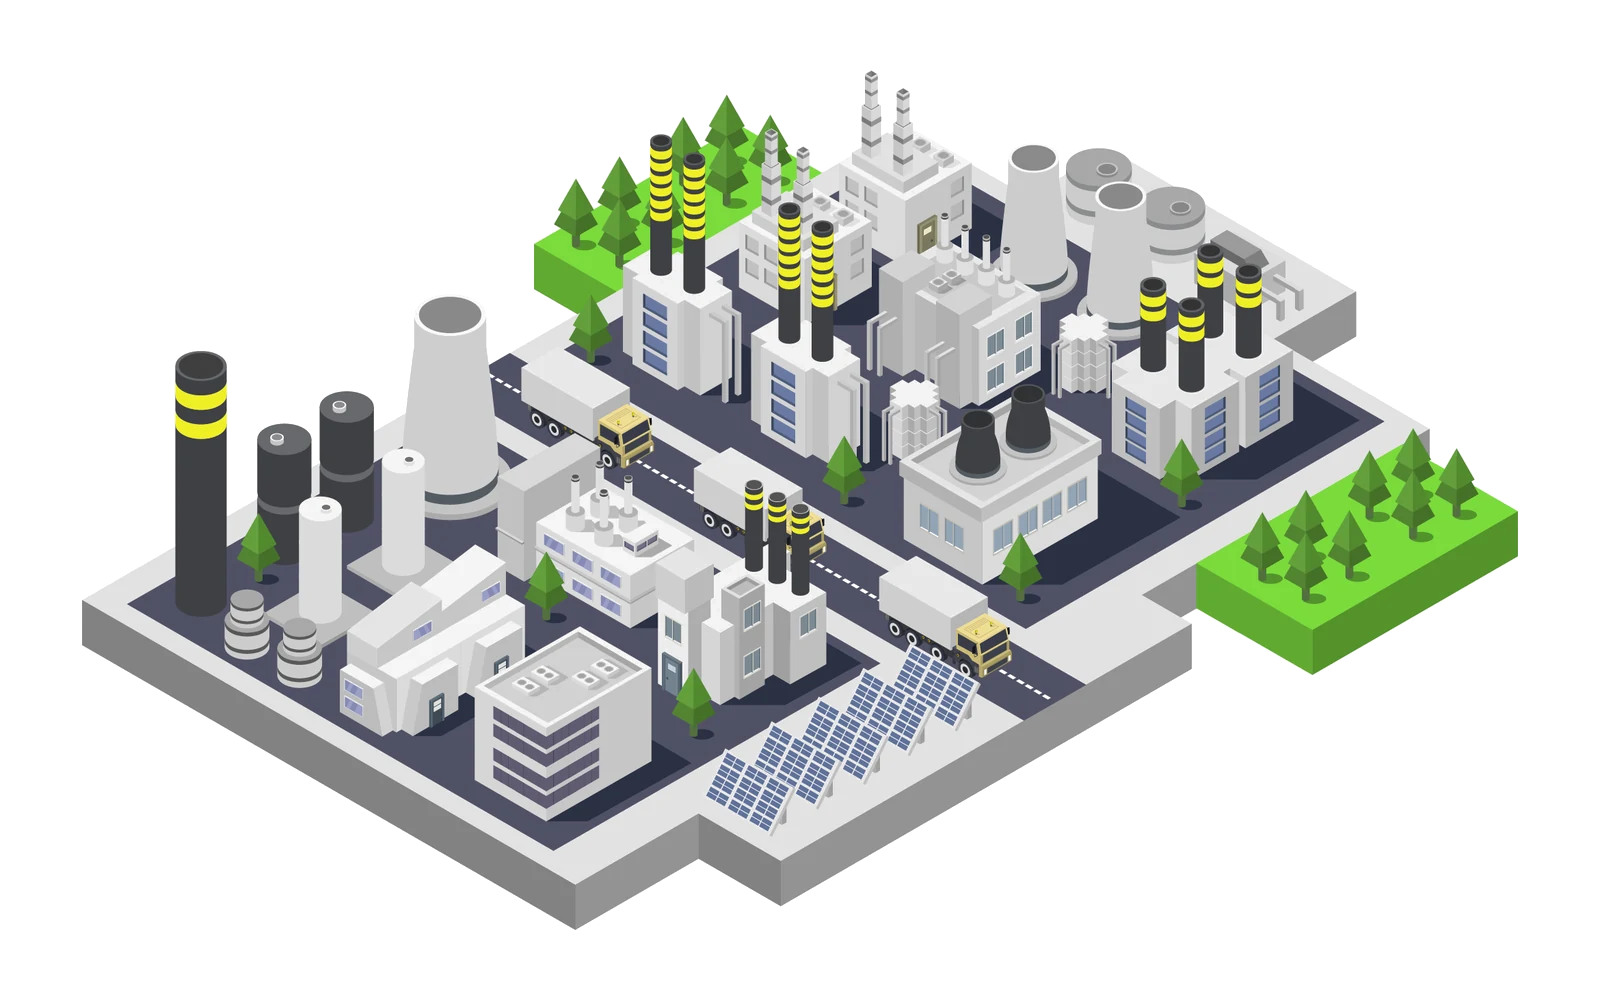
Operational context
Put signals back into equipment, process and space.
DTZ uses versionable SVG views for equipment state, trends, events and governed actions so teams can work from the same operational picture.
- 01SVG screen modelKeep portable visual structure in SVG while managing component behavior separately through element identifiers.
- 02Industrial components and animationProvide industrial symbols, meters, trends, states and animation rules that respond directly to tag values.
- 03Events and actionsDefine clicks, conditions, navigation, writes and workflows explicitly and apply user authorization.
Core capabilities
From product module to reusable operational capability.
The former product name SCADA is now consolidated under DTZ. The codebase includes screen CRUD, industrial symbols, components, animation and events; the released scope remains subject to version acceptance.
SVG screen model
Keep portable visual structure in SVG while managing component behavior separately through element identifiers.
Industrial components and animation
Provide industrial symbols, meters, trends, states and animation rules that respond directly to tag values.
Events and actions
Define clicks, conditions, navigation, writes and workflows explicitly and apply user authorization.
Authoring separated from runtime
Use the editor for configuration while the runtime updates the SVG DOM directly without redrawing the entire page for every signal change.
Data and responsibility flow
Every step stays visible, verifiable and governable.
- 01Create or import an SVG view
- 02Bind elements to tags and state ranges
- 03Define events, actions and permissions
- 04Receive live values and render operational context
Use cases
Start with one high-value loop.
- Production and utility overviews
- Equipment state and anomaly location
- Energy and environmental monitoring
- Operational command views across systems
Responsibility boundary
DTZ supports monitoring, configuration and governed operation. It does not replace safety instrumentation, SIS, PLC interlocks or legally independent control systems.
Current technical baseline: The former product name SCADA is now consolidated under DTZ. The codebase includes screen CRUD, industrial symbols, components, animation and events; the released scope remains subject to version acceptance.