Power and cooling visibility
Correlate distribution, UPS, cooling, temperature, humidity and rack load to understand capacity and thermal risk.


Unify facility, energy, environmental, capacity and security context for IDC and AIDC operations.
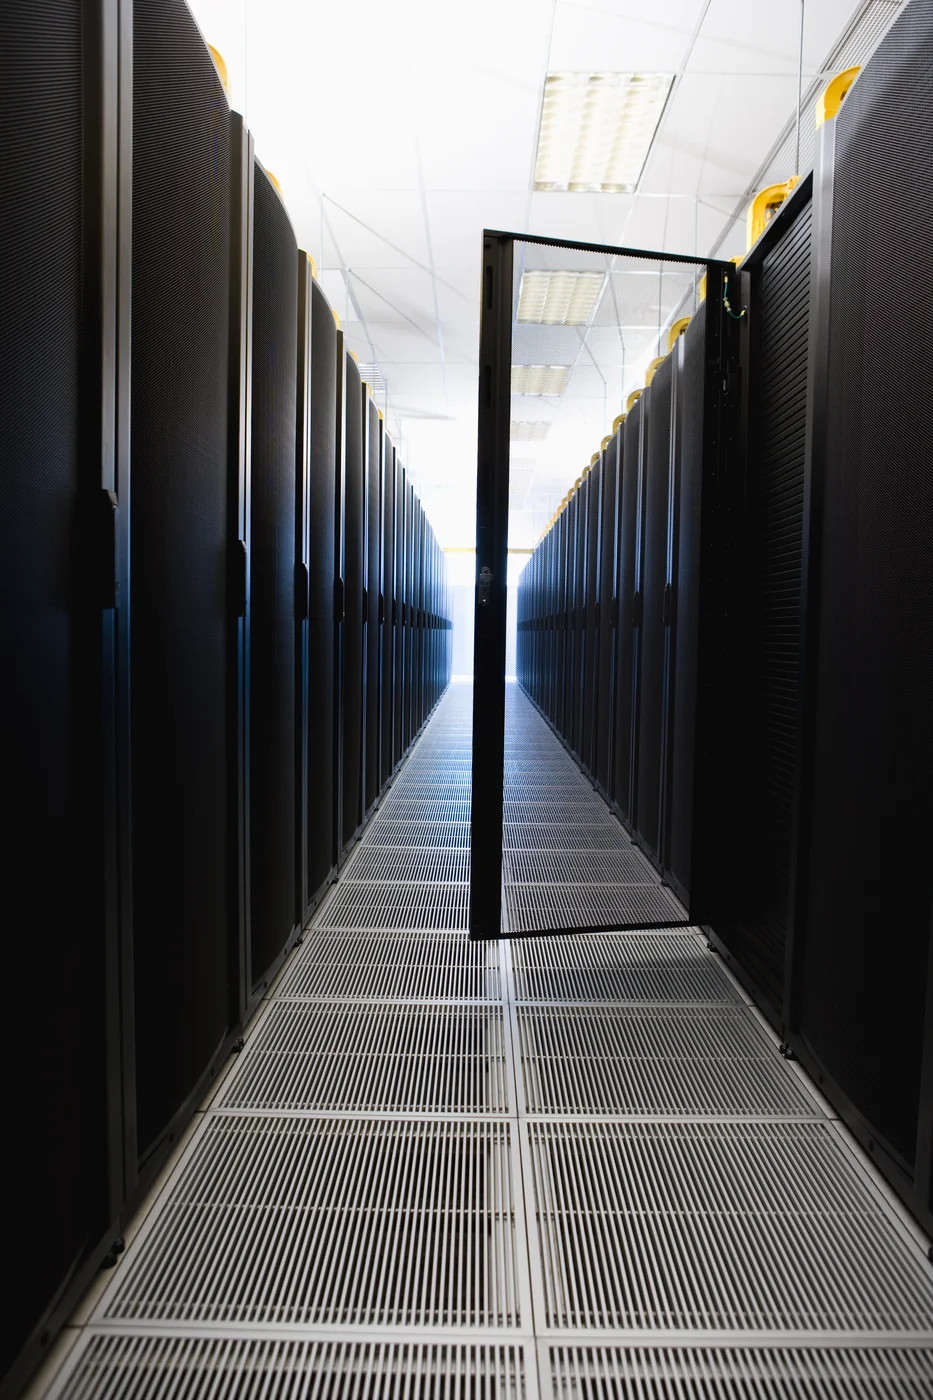

AIDC and high-density data centers face simultaneous pressure across capacity, power, cooling, security and maintenance. X·Neurons connects BMS, DCIM, sensors, alarms, work orders and asset models in a digital-twin context so teams can identify risk before an event and retain learning afterward.
Real digitalization leaves context that the next decision can use.
Correlate distribution, UPS, cooling, temperature, humidity and rack load to understand capacity and thermal risk.
Combine BMS, DCIM, IT monitoring, access control and work orders on one timeline for faster response.
Use DTW to model space, equipment, connections and live state for IDC and AIDC planning and daily operations.
DTW places space, equipment, sensor data and physical conditions in one Twin Model. Operations teams can see the facility as it is, assess hotspots, electrical loading and capacity risk, and compare options before making a real change.

Define sites, rooms, hot and cold aisles, rack rows and equipment coordinates. Manage dimensions, rated power, make, model and version for racks, CRAC/CRAH, UPS, PDU, chillers, CDU and XDU assets.
Bind field tags for temperature, humidity, power, airflow, pressure differential and equipment state to twin assets. PAC, TagBus and TSDB data become model boundary conditions instead of isolated monitoring points.
Calculate temperature and velocity fields from rack heat, intake and exhaust, CRAC supply and return, perforated floors and ducts. Show aisles, rack inlet and return temperatures, thermal margin and emerging hotspots.
Use power-flow models to assess load, voltage drop and equipment loading for capacity review and abnormal-load location. Production projects can add A/B paths, phases, transformers and line parameters from the actual single-line diagram.
Model CDU/XDU capacity, primary and secondary supply and return temperatures, flow, heat-exchange efficiency, coolant and the split between air and liquid cooling so high-density GPU rack heat accounts remain understandable.
Present zone results, equipment hotspots, temperature contours, velocity vectors and downsampled 3D fields on the facility model. Keep complete CFD fields as referenced artifacts so large datasets do not slow the operating view.
Reproduce current facility state from equipment and sensor data and summarize PUE, maximum rack inlet temperature, thermal margin, IT load, return temperature, zone averages, peaks and hotspots.
Compare added load, rack relocation, CRAC outage, airflow and supply-temperature changes. Review KPI deltas, zone-temperature differences and hotspots introduced by each scenario.
Observe load and temperature across future time slices so teams can plan expansion, maintenance and cooling earlier. Inference speed and precision depend on the selected physics solver or surrogate model.
Engineering boundary: DTW provides model, job orchestration, scenario comparison, visual data contracts and solver integration. Complete CFD meshes, boundary conditions, electrical single-line diagrams and PhysicsNeMo/ONNX surrogate models must be configured for the actual equipment, measurements and validation objectives of each facility.
Baselines and targets are defined together during discovery.
Define decisions, users, sources and baselines.
Build the first loop in a bounded environment.
Establish semantic, access and quality governance.
Scale proven patterns across sites.
We begin with constraints, existing systems and accountability boundaries.
Book a discovery session